PIS
Portal


Type of service: Software Developmnt, Project Management and Consulting
Industry: Agriculture
Technologies: C#, .NET 5, Angular, Entity Framework, MySQL
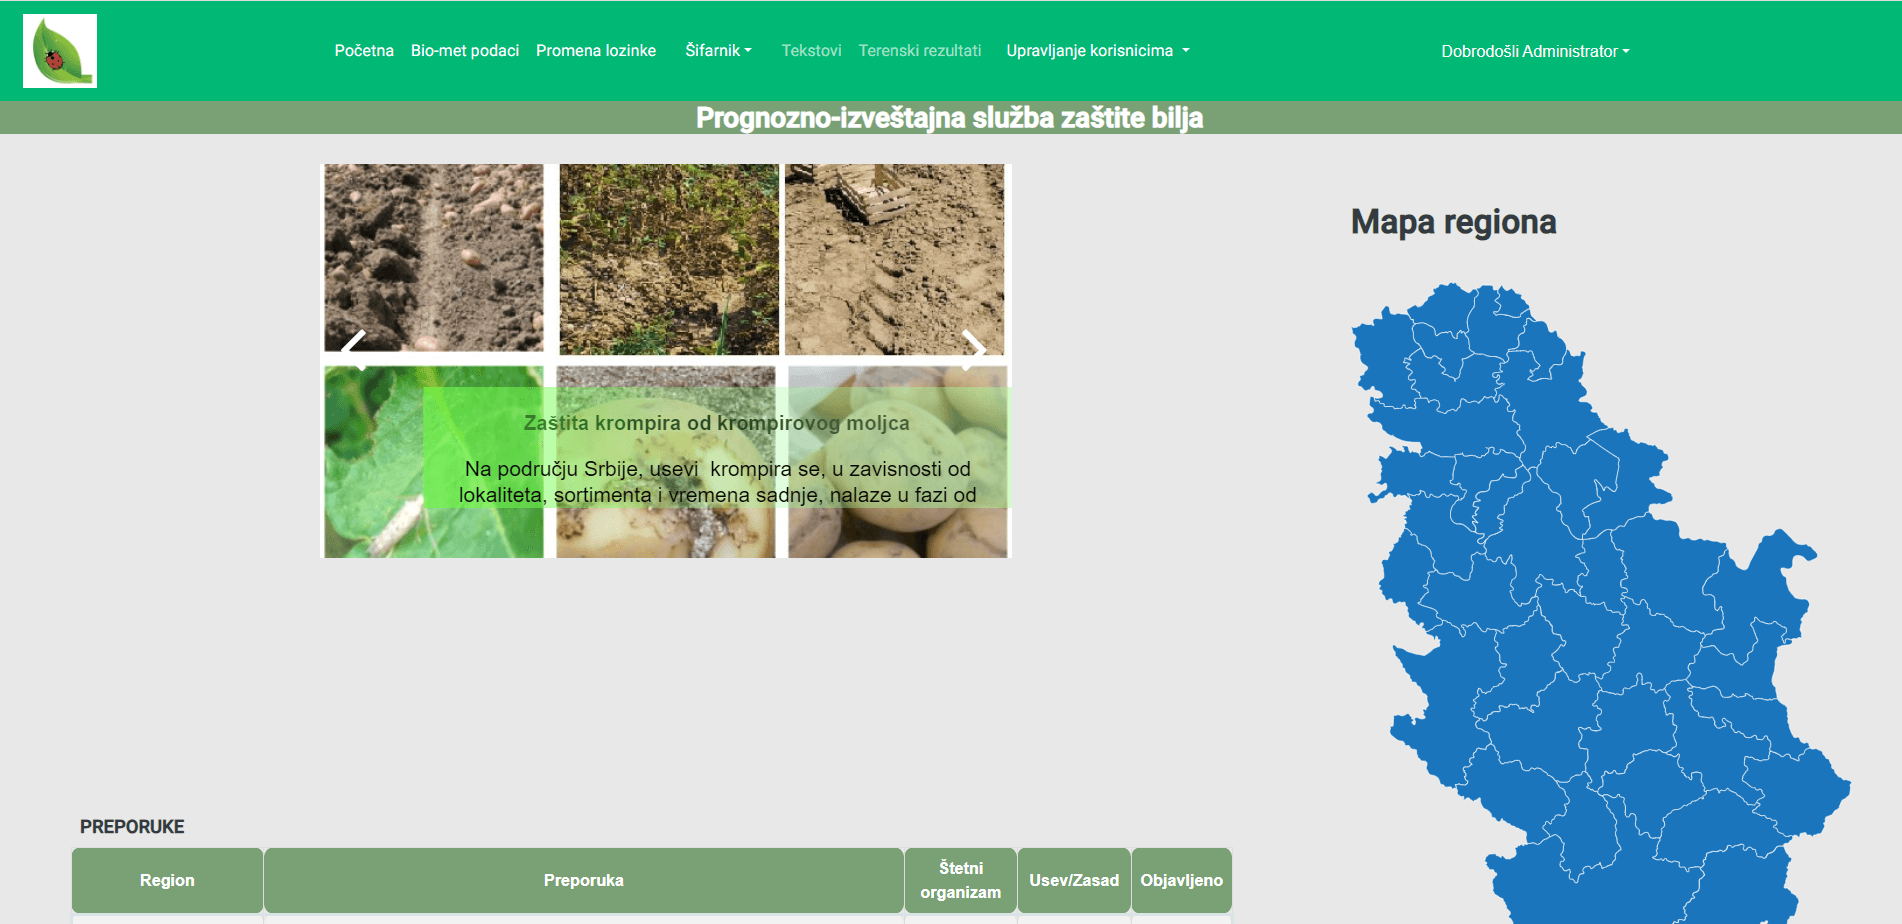
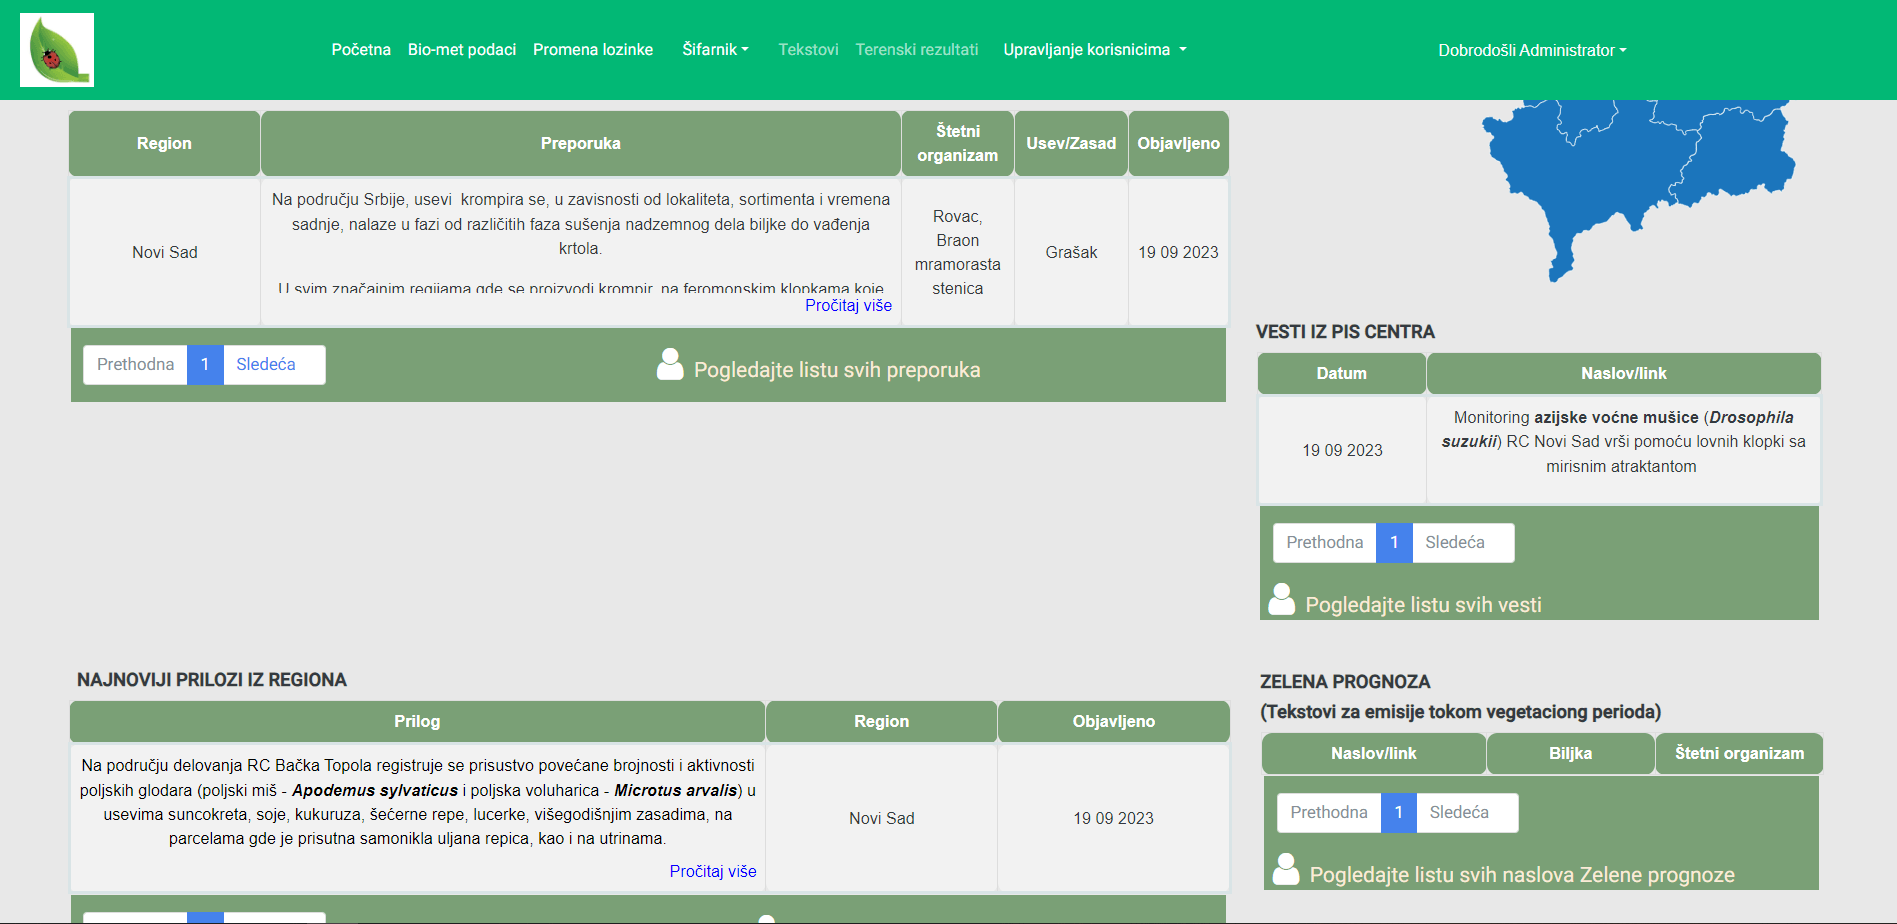
The Agricultural Forecasting and Reporting Service Portal serves to display the most important information, news, features, and recommendations issued by the service. It is a web application with multiple levels of access. The key of this application is information (text, news, feature, or recommendation) that goes through multiple states to reach the end user who wants to see that information and learn more about the desired plant species from highly trained experts who provide recommendations based on field conditions, sensors, images, and various types of testing that generate information.
The first goal of this project was to replace the old system that was on a local server with a new and modern system on a cloud platform, which would make maintenance easier and provide end-users with something completely new. The second goal was to fully improve and automate the writing of relevant information issued by the service and enable end-users to have an easier overview, search, and visibility on different types of devices, unlike the previous solution that was not mobile-friendly.
This project was developed using agile principles and the Scrum framework. The team consisted of 4 developers, one of whom was a QA, a Scrum Master, and a Product Owner. The Product Owner was in constant communication with the client regarding defining the roadmap, backlog, and user stories. The sprint lasted for 3 weeks, where the maximum focus was on development and coding in the first two weeks, while the third week's focus was on testing, test automation, bug fixes, and preparing for the next sprint. At the end of each sprint, a review was organized with the clients where we always received valuable feedback to improve our product and backlog.
After 7 months, the first phase, which entered production, was completed, and currently, the development of the second phase, or the second part of the product that relates to displaying and processing field results that come from various types of sensors in the field and are displayed in the form of various tables and graphs to end-users, is on track.


